What Is a Full-Funnel Growth Diagnostic?
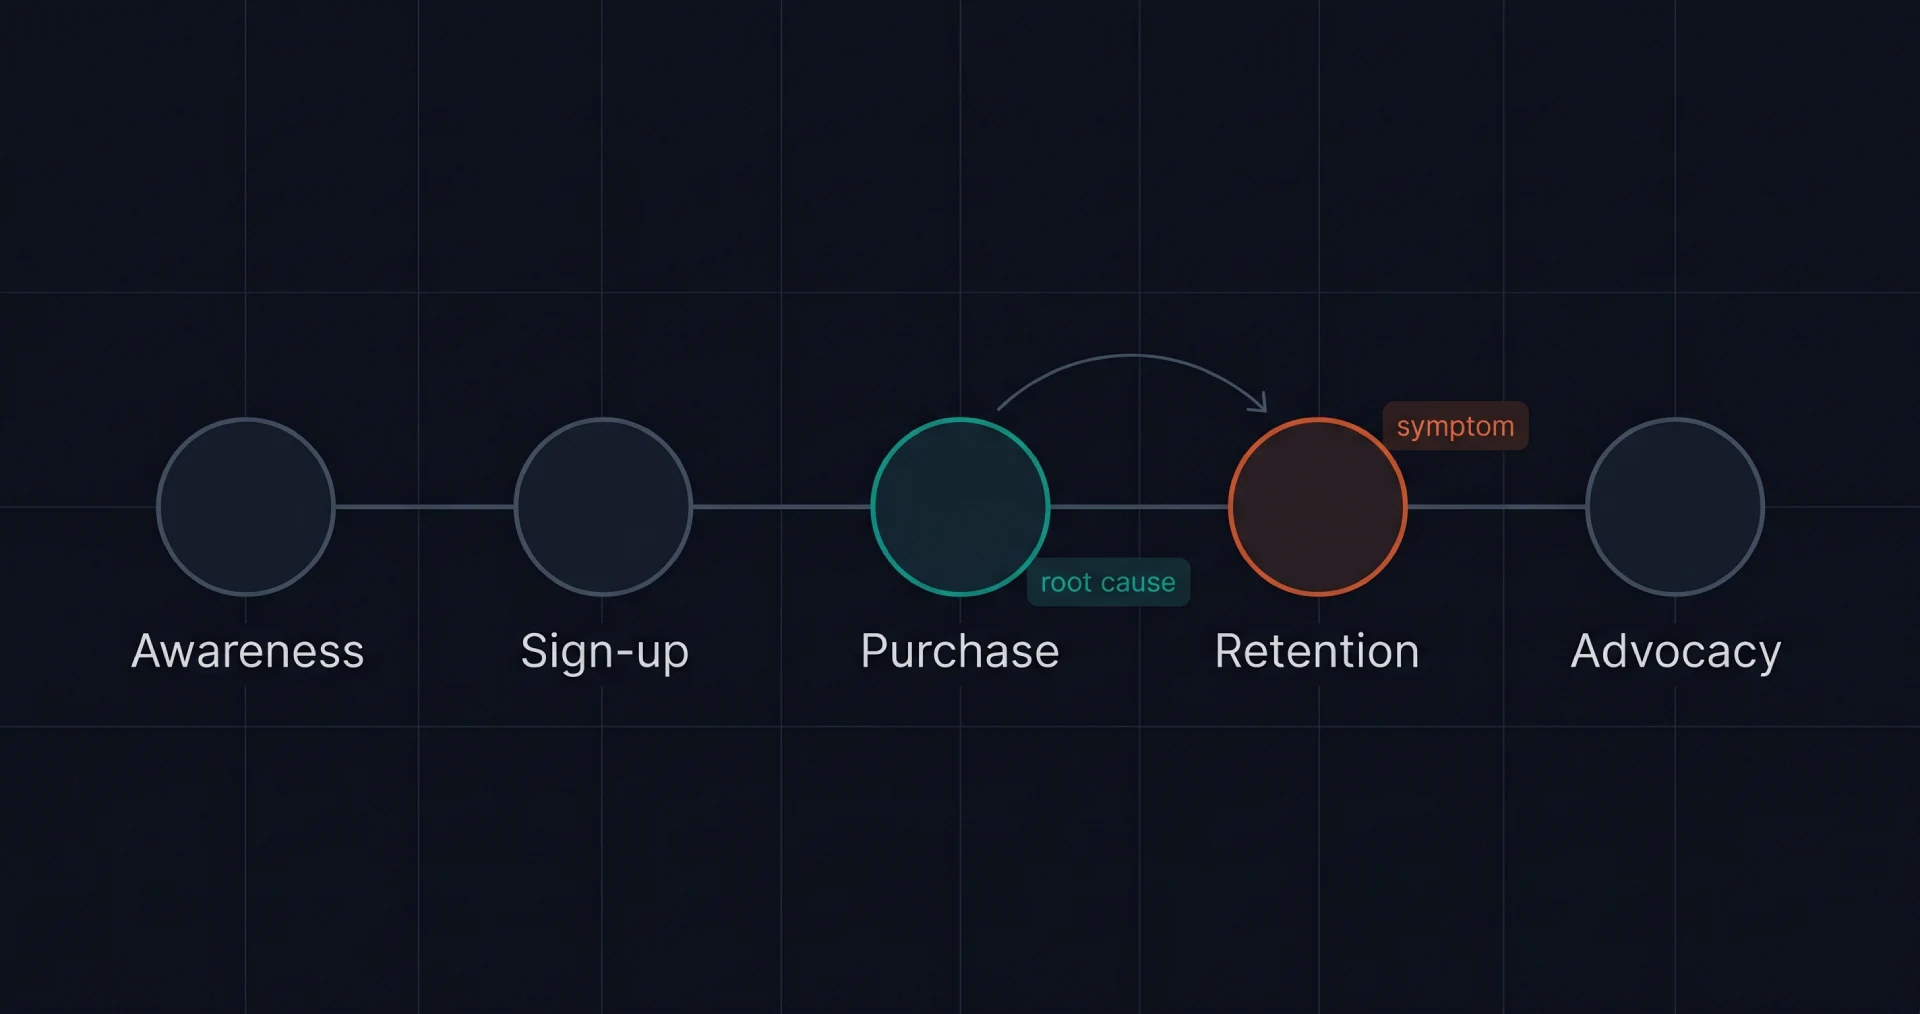
A full-funnel growth diagnostic is a structured audit that examines a subscription app's performance across all five funnel stages — awareness, sign-up, purchase, retention, and advocacy — to identify where the actual revenue leaks are, why they are happening, and which interventions are most likely to move the metric. It differs from specialist audits (an ads audit, a checkout audit, a churn audit) in that it explicitly tests for cross-stage failure patterns: situations where a symptom in one stage traces to a cause in another stage entirely.
The methodology is built on a single observation that holds across most engagements I have run: subscription app growth problems rarely live where they show up. A conversion drop diagnosed as a UI problem is sometimes a fraud filter rejecting legitimate sign-ups. A churn spike diagnosed as product dissatisfaction is sometimes a Stripe dunning misconfiguration. A review spiral diagnosed as an app quality issue is sometimes a pricing change that arrived without communication. Specialists who only know one funnel stage misattribute these patterns routinely. Coverage across all five stages is what allows the diagnosis to travel to the real cause.
Why Subscription App Growth Problems Get Misdiagnosed
The structural reason for misdiagnosis is incentive alignment. A paid-media specialist evaluates a stalled growth metric through paid-media tools — bid strategies, audience signals, creative performance — because that is the surface they can act on. A product manager evaluates the same metric through product analytics — feature adoption, drop-off funnels, A/B test results. Each is competent. Each is also blind to the layers immediately upstream and downstream of their tool surface, and most subscription app growth problems live in the cracks between layers.
The pattern that consistently breaks specialist diagnoses: a signal that was correctly identified at the symptom stage cannot be acted on without a corresponding change at the cause stage. The PMax campaign cannot scale without LTV data flowing through GA4 (the PMax owner cannot fix that). The checkout cannot convert without Stripe Radar rules tuned correctly (the conversion designer cannot fix that). The app store rating cannot recover without product fixes shipped (the marketing team cannot fix that). When the cause stage is owned by a different team, the diagnosis stops at the boundary and the symptom persists.
Key takeaway: Most failed growth interventions are not failures of execution. They are failures of diagnosis at the wrong layer. The intervention works exactly as designed; the underlying problem was somewhere else.
Stage 1 — Awareness
The awareness stage covers everything that produces an impression of the app to a candidate user: paid acquisition (Google App campaigns, Apple Search Ads, Meta), organic search (App Store Optimization, Google Play visibility), referral programs, content, and brand search. The dominant metric for subscription apps is effective Cost Per Install (CPI) or, for web-onboarded apps, effective Cost Per Acquisition (CPA) at the trial start.
The common local misdiagnoses at the awareness stage: blaming creative for a CTR drop when the cause is rating-driven (every star rating drop reduces CTR via the ad-unit display), blaming audience targeting when the cause is conversion-value misreporting (the algorithm is not finding more users because the LTV signal you sent it is too low), blaming budget when the cause is goal-CPA misalignment with realised LTV by country. Each of these surfaces in awareness reporting; the cause sits in advocacy (rating), purchase (conversion-value pipeline), or retention (LTV by cohort).
For deeper guides on the awareness stage in particular, see Performance Max for Subscription Apps for the LTV pipeline that unlocks scaling, and Apple Search Ads optimization for TAP coverage and country-tier goal CPA benchmarking.
Stage 2 — Sign-up
The sign-up stage covers the path from app open or web landing to a created account: auth flow, email verification, social sign-in, sign-up fraud filters, free-trial mechanics, age gates, and any pre-paywall steps. The dominant metrics are sign-up conversion rate (visitor-to-account) and sign-up cost (CAC at the account level, before paid conversion).
The common local misdiagnoses at the sign-up stage: blaming the form length for friction when the cause is a fraud filter rejecting legitimate users (a Radar rule blocking sign-ups from VPN IPs catches both fraudsters and privacy-conscious real users), blaming social-sign-in providers when the cause is consent-mode misfiring on the landing page (the click identifier never persisted, so attribution looks broken), blaming activation when the cause is a deep-link bug between the web onboarding and the mobile app. Each surfaces as a sign-up conversion problem; the cause sits in fraud detection, analytics tracking, or product engineering.
The sign-up stage interacts particularly closely with the purchase stage in subscription apps because most fraud filtering and risk scoring is configured for downstream protection. Loosening a sign-up filter to recover legitimate users typically requires tightening the corresponding purchase-stage filter, and that trade-off only resolves cleanly when both stages are diagnosed together.
Stage 3 — Purchase
The purchase stage covers everything that converts a created account into a paying subscriber: paywall presentation, payment method mix, 3D Secure (3DS) gating, card decline recovery, fraud filtering at purchase time, and the chargeback risk that follows. The dominant metrics are trial-to-paid conversion rate, payment success rate, chargeback ratio, and dispute rate.
The common local misdiagnoses at the purchase stage: blaming pricing for a trial-to-paid drop when the cause is dunning failures on first renewal (the user paid; their card declined the second invoice and the dunning sequence did not recover it), blaming the paywall for low conversion when the cause is consent-mode misfiring (the conversion event fired but did not flow back to the bidding signal), blaming the processor for a chargeback rise when the cause is a Stripe Link configuration that bypassed CVC and AVS checks. The purchase stage is also where compliance programs (Mastercard ECM, Visa VAMP) attach; sustained breach of either pulls processing privileges entirely.
For deeper guides on the purchase stage, see How to Exit Mastercard's ECM Program for chargeback compliance and a 90-day exit playbook, and Visa VAMP Explained for the combined fraud-and-dispute ratio framework that replaced VDMP and VFMP in April 2025.
Stage 4 — Retention
The retention stage covers everything that keeps a paying subscriber paying: lifecycle email and push, in-app engagement loops, churn diagnostic surfaces, dunning flows for failed payments, win-back campaigns, and feature adoption mechanics. The dominant metrics are voluntary churn rate, involuntary churn rate (failed payments), revenue retention, and cohort retention curves at days 30, 60, and 90.
The common local misdiagnoses at the retention stage: blaming product dissatisfaction for a churn spike when the cause is an involuntary-churn driver (a card-network update changed BIN ranges and the dunning system did not handle it), blaming pricing for a downgrade trend when the cause is a paywall change that surfaced lower tiers more aggressively to existing subscribers, blaming engagement for a cohort decay when the cause is an upstream acquisition shift toward lower-LTV traffic. The retention stage is where lower-stage data quality compounds — every error in earlier-stage tracking produces a biased view of which users are actually churning and why.
The interaction between retention and tracking is particularly important. Cohort analysis only works when transaction IDs are deduplicated, when consent-mode misfires are not silently dropping events, and when the click-identifier-to-user-record join is intact. The GTM and GA4 tracking forensics guide covers the diagnostic discipline that protects retention analysis from upstream tracking bugs.
Stage 5 — Advocacy
The advocacy stage covers the user-generated and user-amplified surfaces: App Store and Google Play reviews, NPS, referral programs, social mentions, and word-of-mouth velocity. The dominant metrics for subscription mobile apps are the App Store rating (per-version and cumulative), the Google Play rolling 12-month rating, and the new-review rating average on a 7-day rolling window.
The common local misdiagnoses at the advocacy stage: blaming a one-star spiral on bad luck when the cause is a release regression that hit on a specific iOS minor version, blaming negative reviews on competitors when the cause is a coordinated review attack from a single forum, blaming low rating intake on prompt fatigue when the cause is the prompt firing at first launch instead of after a high-value action. Apple's three-prompts-per-365-days budget is small enough that misusing it on uninformed users produces a structural rating ceiling.
The advocacy stage feeds back into awareness more directly than any other stage. Star ratings appear in ad units; a 0.4-star rating drop reduces ad CTR meaningfully and raises effective CPI for the same audience. The cross-stage symptom — paid acquisition CPI rising — is one of the most reliable signals that the diagnosis needs to look at advocacy, not at the ad accounts. For a deeper diagnostic playbook, the App Store Review Recovery service page documents the five root cause categories and the two-week recovery framework.
Cross-Stage Failure Patterns
Three failure patterns recur across nearly every subscription app I have diagnosed. Each pairs a symptom in one stage with a cause in another, and each requires diagnostic coverage of both stages to find the real fix.
| Symptom (where it shows up) | Cause (where it lives) | Diagnostic signal |
|---|---|---|
| Rising paid acquisition CPI / falling ad CTR (awareness) | App store rating drop driven by release regression, pricing change, or fraud attack (advocacy) | New-review average rating moves first; ad CTR follows 1–2 weeks later. Ratings ≥0.3 stars below baseline. |
| Sign-up conversion falling (sign-up) | Fraud filter (Stripe Radar, sign-up rule set) rejecting legitimate users (purchase) | Sign-up funnel drop is concentrated on specific BINs, IP ranges, or geographies. Support tickets spike with "I can't sign up" themes. |
| Trial-to-paid declining (purchase) or churn rising (retention) | Payment dunning failures on first renewal (purchase infrastructure) | Involuntary churn share rising as a percentage of total churn. Stripe Sigma or RevenueCat shows declined-card retry success rate falling. |
| PMax stuck at low budget utilization (awareness) | Conversion value reported back to Google reflects only first transaction, not LTV (purchase + tracking) | Budget utilization <50% on flat creative and audience. Effective CPA headroom is bounded by a value materially below realised LTV. |
| Review spiral starting (advocacy) | Mid-trial price change without grandfathering (purchase / pricing) | One-star reviews concentrated within days of pricing decision date. Verbatim text references the price change explicitly. |
Key takeaway: If the team is debugging a metric for more than 30 days without progress, look one stage upstream and one stage downstream. The cause is almost never in the same stage as the symptom for problems that survive that long.
The 10-Point Diagnostic Checklist
The checklist below is the first pass of a full-funnel diagnostic. Each item is a yes-or-no question that surfaces a specific failure mode. Answering "no" or "I do not know" to three or more is a strong signal that a structured diagnostic would be high-value before another expensive intervention launches.
- Awareness: Is the conversion value Google Ads sees the realised LTV or the first-transaction value?
- Awareness: Are Apple Search Ads running across all four TAP placements (Today, Search, Search results, Product Pages)?
- Sign-up: Does the sign-up fraud filter reject more than 1% of total attempts? If so, has the legitimate-rejection rate been measured?
- Sign-up: Is the click identifier (GCLID, GBRAID, WBRAID) being captured and persisted to the user record on first session?
- Purchase: Is the chargeback ratio below 0.30% combined for VAMP and below 1.0% for ECP?
- Purchase: Has the Stripe Link configuration been audited for CVC and AVS bypass?
- Retention: Is involuntary churn (failed payments) less than 30% of total churn? If higher, has the dunning sequence been re-evaluated in the last 6 months?
- Retention: Are GA4 transaction IDs deduplicated, and do GA4 revenue figures reconcile to Stripe revenue within 3%?
- Advocacy: Has the App Store rating moved more than 0.2 stars in the last 30 days? If yes, has the cause been mapped to one of the five root cause categories?
- Cross-stage: Are paid acquisition, sign-up, purchase, retention, and advocacy data sources joinable to a single user record? If not, cross-stage diagnosis is impossible by definition.
When DIY Works vs When to Escalate
Run the diagnostic in-house when the team has cross-functional access (analytics, payments, product, support all reachable through one person), the data is already centralised in a way that allows joining across stages, and the team has at least 4 to 6 weeks of buffer before the next major intervention launches. Most teams with strong analytics maturity can run the first pass of the 10-point checklist themselves and identify the top-2 priority issues without outside help.
Escalate when the team has tried specialist interventions (an ads audit, a checkout audit, a churn analysis) without moving the headline metric, when the cross-stage data joins are broken or partial, when growth has been flat for two or more quarters, or when multiple metrics are moving in unexpected directions simultaneously and the team cannot identify a single hypothesis. The structural cost of diagnosing the wrong stage is high — every cycle of intervention against the wrong layer is a cycle that compounds the underlying cause while the team believes they are addressing it.
Frequently Asked Questions
A structured audit examining a subscription app's performance across all five funnel stages — awareness, sign-up, purchase, retention, advocacy — to identify where the actual revenue leaks are and which interventions are most likely to move the metric. It differs from specialist audits in explicitly testing for cross-stage failure patterns where a symptom in one stage traces to a cause in another.
Specialists who only know one funnel stage misattribute problems routinely because the symptom rarely lives where the cause does. A conversion drop diagnosed as a UI problem can be a fraud filter rejecting legitimate sign-ups. A churn spike diagnosed as product dissatisfaction can be a payment dunning failure. Without coverage across all five stages, the diagnosis stops at the symptom and the intervention fails.
Two weeks for a single subscription app. Week one is data gathering and analysis across all five stages. Week two is synthesis: mapping each symptom to its root cause, prioritising interventions by expected revenue impact versus engineering effort, and producing a written remediation roadmap.
Read-only access to analytics platforms (GA4, Mixpanel, Amplitude), the payment processor (Stripe, RevenueCat, Adyen), ad platforms (Google Ads, Apple Search Ads, Meta), the app stores, the support system, and the MMP if one is in use. Codebase access is generally not required — the diagnostic is a data exercise, not an engineering review.
Three patterns recur. (1) Paid acquisition CPI rising because the app store rating dropped (symptom in awareness, cause in advocacy). (2) Sign-up conversion falling because a fraud filter is rejecting legitimate users (symptom in sign-up, cause in purchase risk management). (3) Churn increasing because payment dunning is failing on renewal (symptom in retention, cause in payment infrastructure).
When growth has plateaued and the team cannot identify a single cause, when multiple metrics are moving in unexpected directions simultaneously, when prior interventions have failed despite executing correctly, or when paid acquisition spend cannot be traced to retained subscribers. The diagnostic is most valuable before another expensive intervention launches, not after.
Most growth marketing audits scope to acquisition channels — ad accounts, creative, audience targeting. A full-funnel diagnostic explicitly extends past acquisition into sign-up, payments, retention, and reviews, on the premise that subscription app growth is gated as much by what happens after the click as by what happens before. The most expensive growth problems for subscription apps tend to be downstream of the ad click, not upstream.